
On the Report
Photos Without the Tag Workaround
Until this release, a photo only printed on the cube sheet if the item carried a tag. So reps who wanted the pictures started tagging items “Odd Shaped” that were not odd shaped at all, purely to force the photo through. The picture came out right and the tag data came out wrong, in a document the customer reads.
Photos are now independent of tags. Under … More → PDF report → Item photos, switch on Display photo for every item that has one. A running count underneath tells you how many photographed items will print before you generate anything.
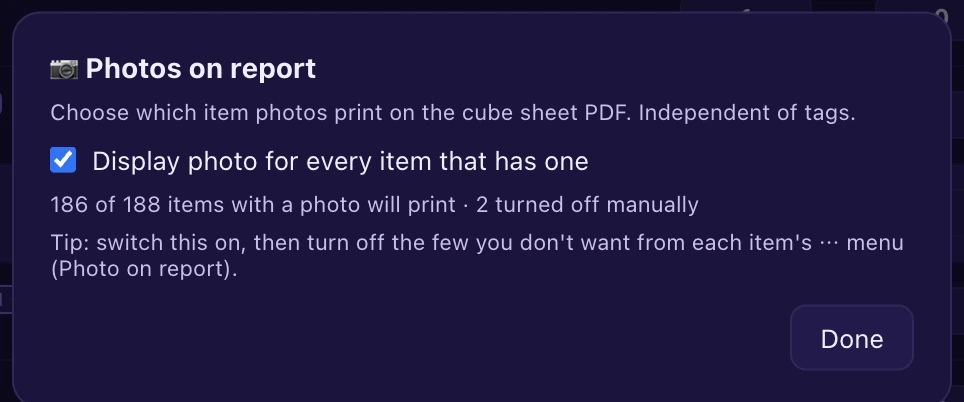
One switch for the whole survey. The count keeps track of the ones you turn off.
Then turn off the handful you don’t want. Each item’s … menu has its own Photo on report switch, shown only on items that have a photo. Global on, a few off by hand, which is how a rep actually works through a report.
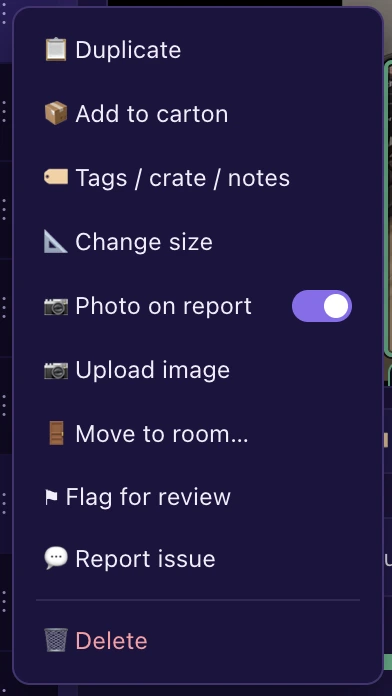
The per-item switch sits in the same menu as everything else you do to an item.
On the PDF, each photo prints as a thumbnail inside the item’s own row. No separate photo section to cross-reference, no duplicate rows.
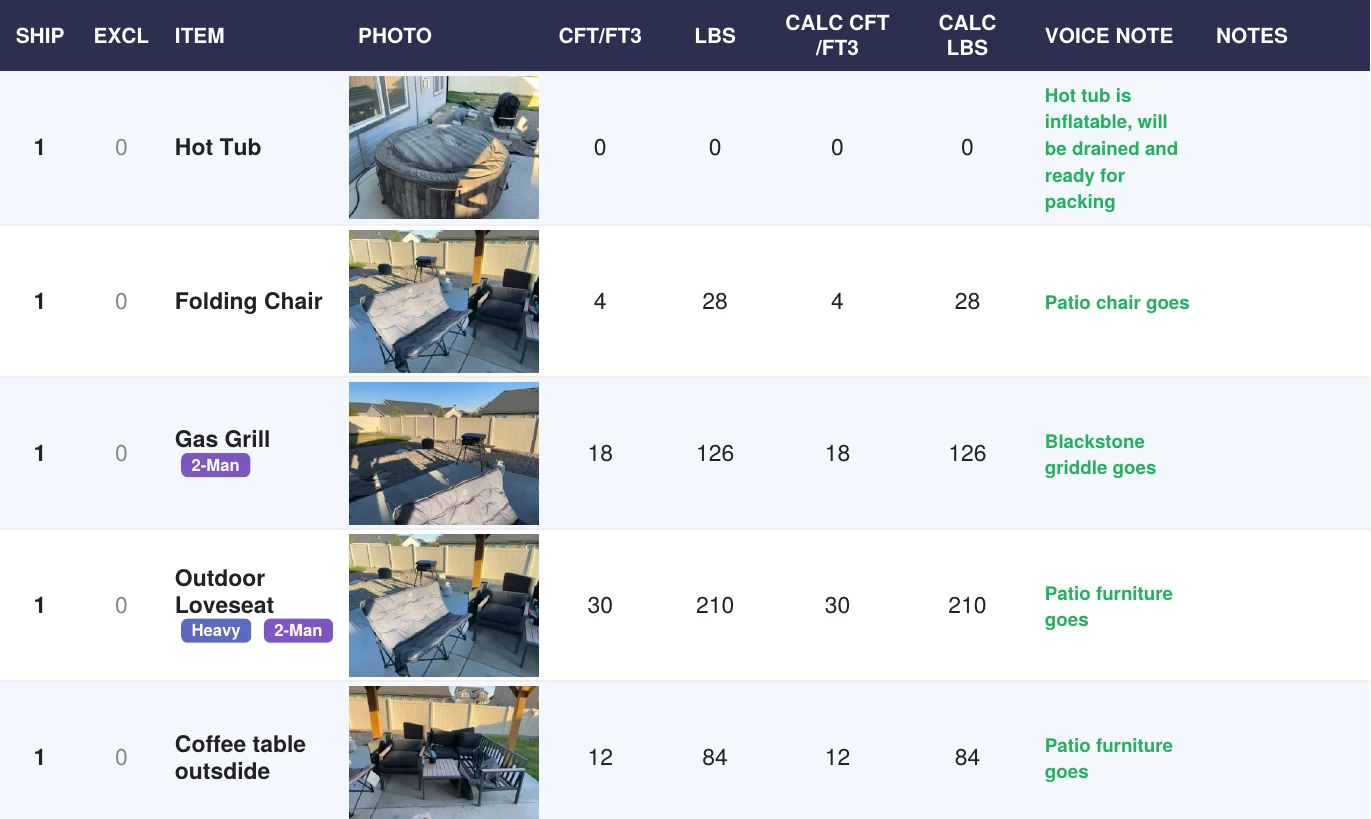
The photo prints where the item is, not in an appendix at the back.
Tags go back to meaning what they say.
Totals You Can Negotiate With
Tag Summary Tables in the Cube Sheet
Tagged items were already grouped in the PDF. What they never had was a total, and the total is the part you actually use. When a customer is standing in the living room deciding what comes and what stays, the useful sentence is not “here are your Maybe items.” It is “here are your Maybe items, and they add up to this much.”
Under … More → PDF report → Tag summary, you see the tags actually on this survey, each with an item count. Tick the ones worth summarizing for this job, whether that is Maybe, Fragile, High Value or Dismantle.
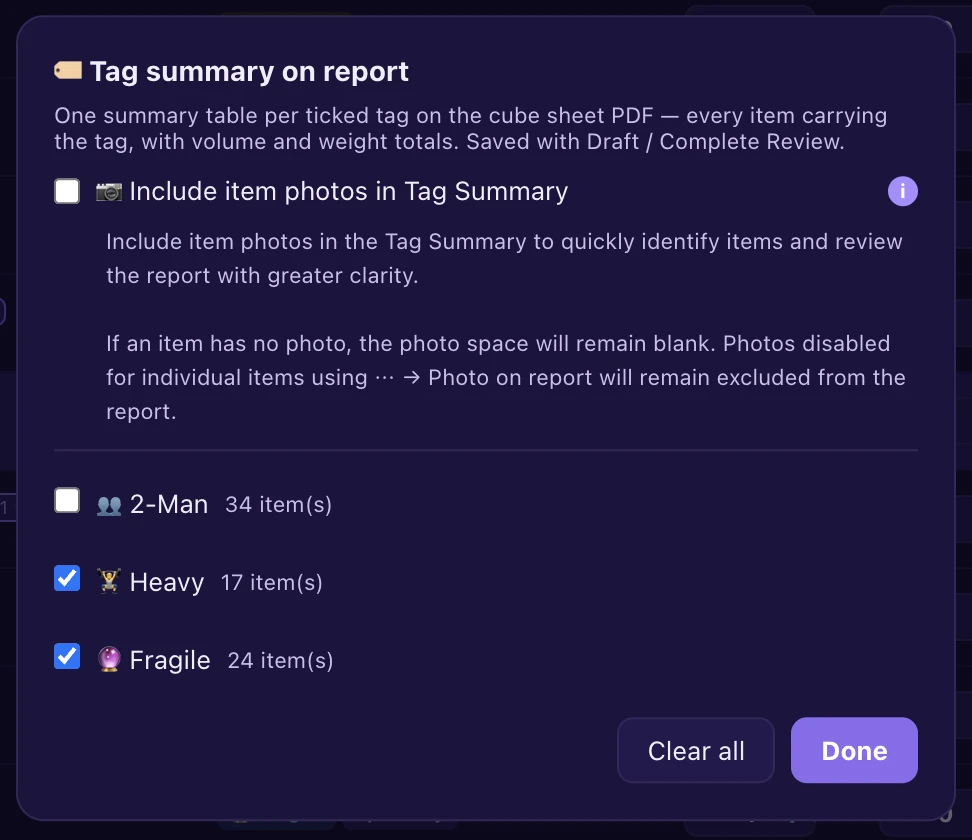
Only the tags this job used, with the item count against each.
The PDF then gets one table per ticked tag: item, room, quantity, volume and weight, with a total row at the bottom. The tables sit after the rooms and before the questionnaire. Totals follow the same rules as the printed rows, so they reconcile with the survey totals instead of arguing with them.
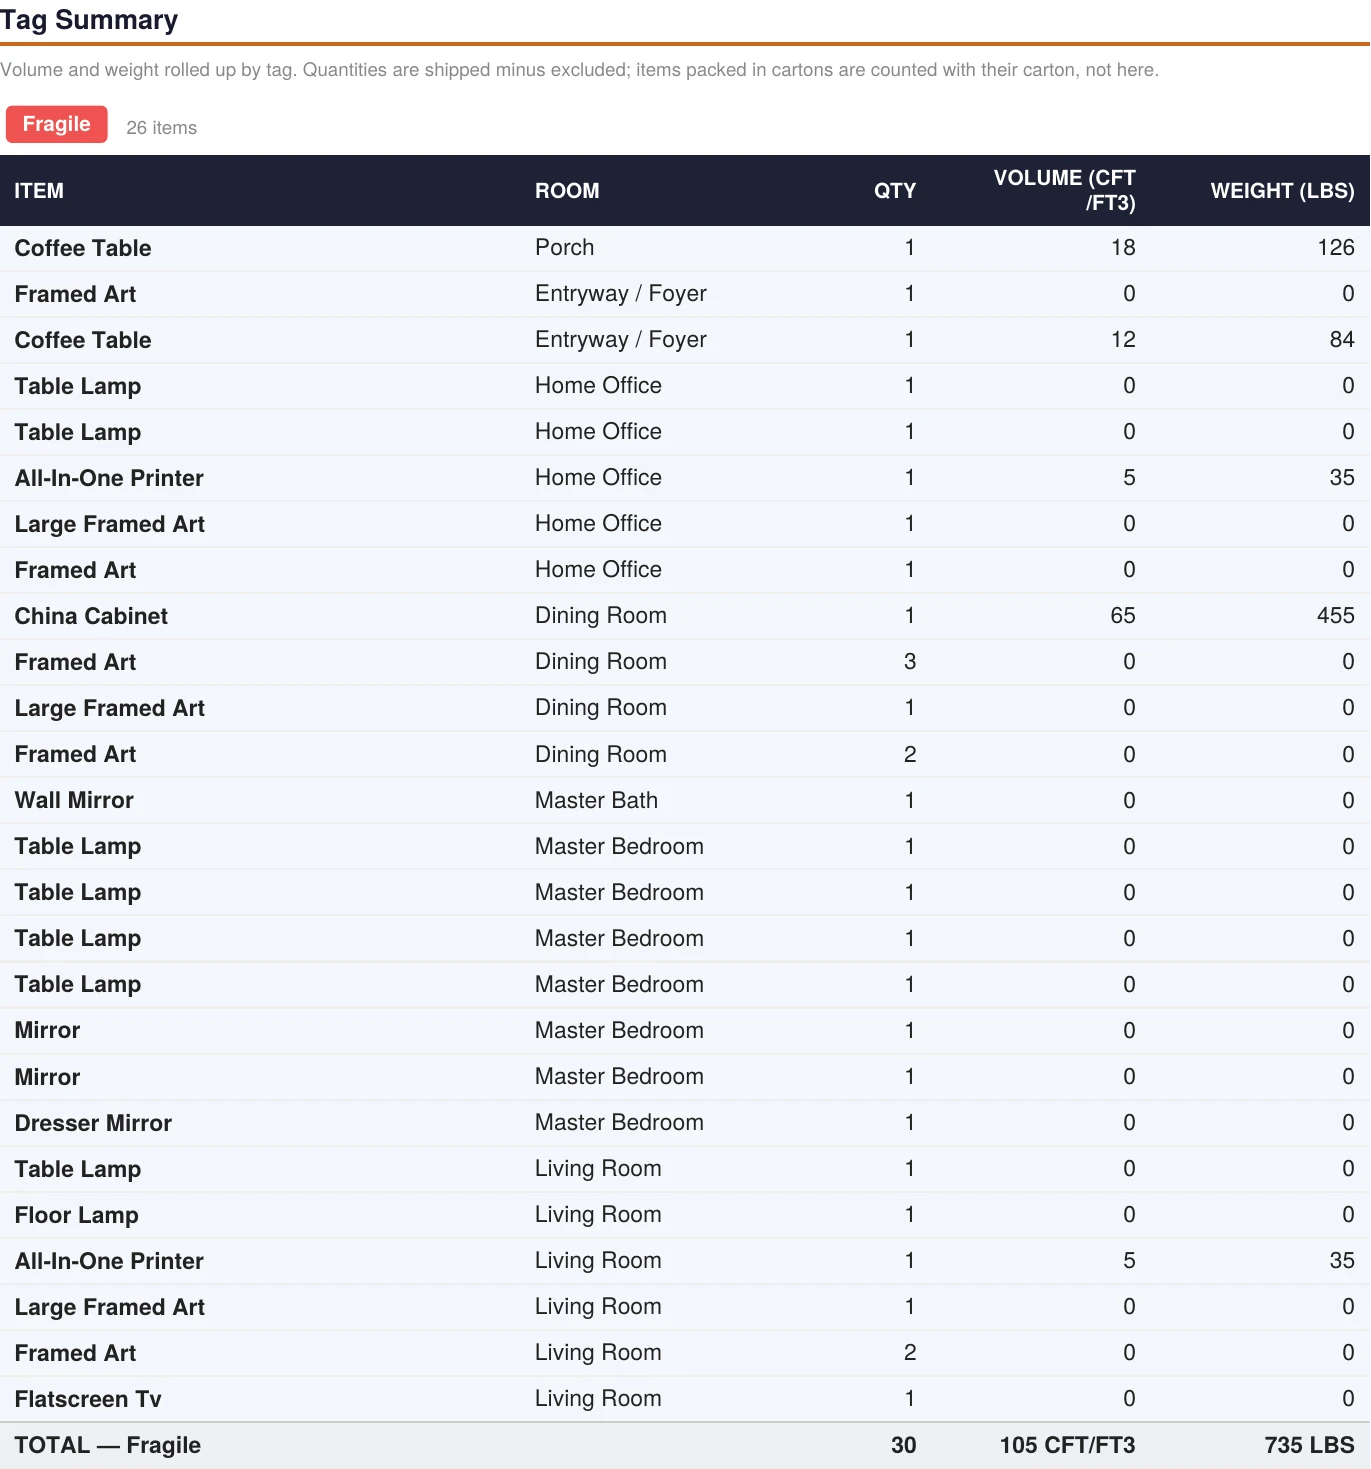
Every Maybe item in one place, with the number you are negotiating.
Items packed inside a carton show in the table but carry their volume and weight with the carton, so nothing is counted twice. Your selection saves with the draft or the completed review, so it travels with the survey. Tick nothing and the PDF comes out exactly as it did before.
One Tap, Right Numbers
Nobody Knows What a King Bed Weighs
The AI called it a sofa. It is a three-seater, and it is the big one. Until this release the only fix was to rename the item and type a new weight by hand, which meant a rep had to know, off the top of their head, what a king bed weighs versus a queen. Nobody knows that. So the number got guessed, and a guess in the weight column travels all the way to the cube sheet.
Every item’s … menu, and the item detail panel, now has Change size. It opens the catalog with the item’s own family already searched: a sofa brings up every sofa with the closest match first, a king bed brings up every bed size, and category chips are there to browse further.
One tap sets the item’s name, volume and weight from the catalog together.
Wrong size, one tap.
Right name, right volume, right weight.
Nobody has to remember what a king bed weighs.
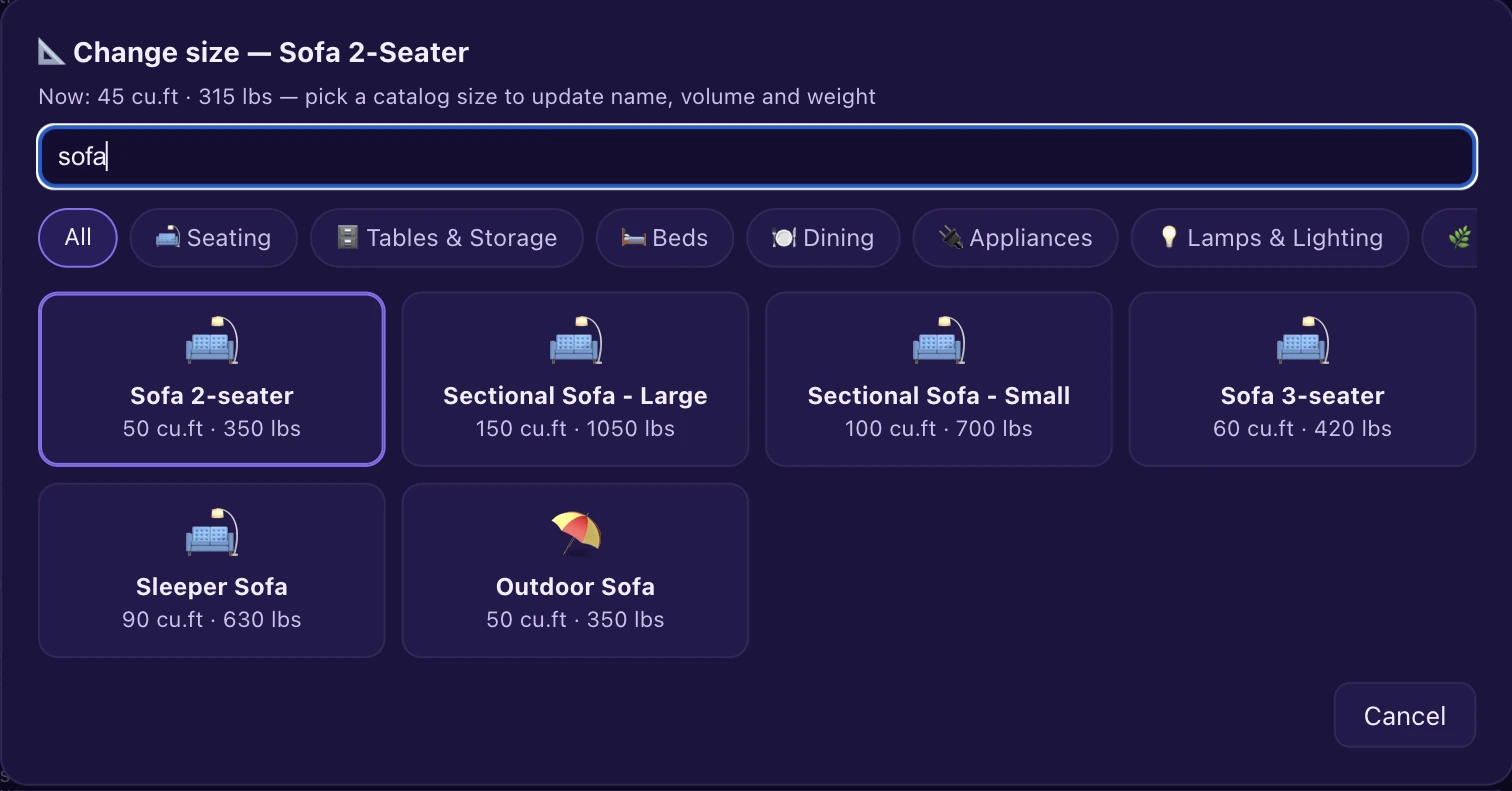
It opens on the item's own family, shows what it is now, and every size carries its own numbers.
Tags that mean what they say. Totals you can use.
Every one of these is live on your dashboard today. Not surveying with HomeSurvey.ai yet? Your first 10 surveys are on us.
Start Your Free Trial